Configuration Reference
eDR-Graph uses a layered configuration system with the following priority chain (highest to lowest):
- CLI arguments — Override everything
- Environment variables — Override config file and defaults
- Config file (
config.yaml) — Override defaults - Pydantic defaults — Built-in sensible defaults
Environment Variables
| Variable | Description | Default |
|---|---|---|
DEEPINFRA_API_KEY |
API key for LLM threat analysis (Gemma3-27B via DeepInfra) | "" (LLM analysis disabled) |
ABUSEIPDB_API_KEY |
AbuseIPDB API key for IP reputation | "" (graceful fallback) |
VIRUSTOTAL_API_KEY |
VirusTotal API key for file/URL/IP reputation | "" (graceful fallback) |
EDR_DATA_DIR |
Data directory for graph DB, SQLite queue, and quarantine | ./edr_data |
EDR_QUARANTINE_DIR |
Quarantine directory for isolated files | /var/edr-graph/quarantine (Linux/macOS) |
EDR_HEARTBEAT_DIR |
Watchdog heartbeat file directory | /tmp/edr-heartbeats |
EDR_AGENT_ID |
Agent UUID for fleet registration | "" (auto-generated) |
EDR_REGISTRATION_KEY |
Registration key for fleet enrollment | "" |
CLI Arguments
| Argument | Description | Default |
|---|---|---|
--config |
Path to config.yaml file |
None (auto-detect) |
--data-dir |
Data directory path | ./edr_data |
--dashboard-port |
Dashboard HTTP port | 9200 |
--port |
Alias for --dashboard-port |
9200 |
--log-level |
Log level: DEBUG, INFO, WARNING, ERROR |
INFO |
--log-format |
Log format: text (console) or json (structured) |
text |
--metrics-port |
Health/metrics HTTP port | 9100 |
--auto-respond |
Auto-execute response actions for CRITICAL severity | false |
--no-dashboard |
Run without the web dashboard | false |
--no-tray |
Disable macOS menu bar tray icon | false |
--no-watchdog |
Disable watchdog heartbeat | false |
--no-tamper-check |
Disable tamper detection | false |
--generate-config |
Print default config.yaml to stdout and exit |
— |
--fleet-url |
Fleet server gRPC address (host:port) |
"" |
--fleet-enabled |
Enable fleet forwarding | false |
--agent-id |
Agent UUID for fleet registration | "" |
--registration-key |
Registration key for fleet enrollment | "" |
Config File Reference
Authoritative source
The config sample below may drift from the actual Pydantic models over time. To generate the current default config with all documented fields, run:
The config file uses nested YAML with the following structure. All values shown are defaults.
# EDR Graph Agent Configuration
# Values here are overridden by environment variables and CLI arguments.

agent:
  name: "edr-graph-agent"
  log_level: "INFO"           # DEBUG, INFO, WARNING, ERROR
  log_format: "json"          # "json" or "text"
  data_dir: "./edr_data"

collector:
  poll_interval: 1.0          # Seconds between collection cycles
  buffer_size: 500            # Max events per processing batch
  event_retention_hours: 24   # Auto-prune processed events older than this

# Note: analyzer_interval (default 60s) controls how often the LLM
# analyzer runs. Not currently exposed in config.yaml — set via
# Pydantic default only. See performance/os-capabilities for latency impact.

analysis:
  llm:
    model: "google/gemma-3-27b-it"
    api_key_env: "DEEPINFRA_API_KEY"   # Read API key from this env var
    # Never put API keys directly in this file!
  dga:
    entropy_threshold: 3.5
    score_threshold: 0.6
    allowlist:
      - "googleapis.com"
      - "cloudflare.com"
      - "amazonaws.com"
      - "windows.net"
      - "office365.com"
      - "microsoftonline.com"
  ioc_feeds_enabled: true
  ioc_feeds_refresh_hours: 4

response:
  mode: "passive"             # "learning", "active", or "passive"
  baseline_graph_gating: true # Filter baselined edges in non-learning modes
  auto_respond: false         # Auto-execute for CRITICAL severity
  auto_terminate: false       # Allow process termination without approval
  # quarantine_dir: "/var/edr-graph/quarantine"

persistence:
  watchdog_enabled: true
  heartbeat_interval_seconds: 10
  tamper_check_interval_seconds: 60

metrics:
  enabled: true
  port: 9100

dashboard:
  port: 9200
  refresh_interval: 5.0
  auto_open_browser: true

tray:
  enabled: true               # macOS only, ignored on other platforms
  notification_cooldown_seconds: 60
  notify_on_high: true
  notify_on_critical: true

graph:
  max_memory_mb: 512          # Kuzu buffer pool size limit (MB)
  ttl_hours: 24               # Delete graph edges older than this

enrichment:
  process_identity:
    enabled: true
    cache_size: 500
  port_mapper:
    refresh_interval_seconds: 30.0
  allowlist:
    enabled: true
    custom_entries: []
  connection_metadata:
    enabled: true
    retention_hours: 24

fleet:
  enabled: false
  url: ""                     # Central server gRPC address (host:port)
  forward_interval: 10
  forward_events: false       # Forward raw OCSF events (high volume)
  heartbeat_interval: 30
  queue_max_size: 10000
  retry_max: 5
  public_ip_interval: 300
  flight_recorder_ttl_hours: 6
  ntp_server: "pool.ntp.org"
  ntp_sync_interval: 300
Dynamic Memory Allocation
The Kuzu graph database buffer pool size is automatically calculated at startup unless explicitly set in config.yaml:
- Formula:
min(256, max(128, total_memory * 0.0625))MB - Uses the lower of physical RAM and cgroup memory limit (container-aware)
- On a 4 GB host:
4096 * 0.0625 = 256 MBbuffer pool - Kuzu typically uses ~3x the buffer pool for query processing, so 256 MB → ~768 MB total Kuzu memory
The conservative 6.25% allocation leaves headroom for Python, SQLite, IOC feeds, the PID index, and OS overhead.
Override
Set graph.max_memory_mb in config.yaml to override automatic calculation:
Config File Locations
When --config is not specified, the agent searches for config files at:
| Platform | Path |
|---|---|
| Linux / macOS | /etc/edr-graph/config.yaml |
| Windows | C:\ProgramData\edr-graph\config.yaml |
If no config file is found, all Pydantic defaults are used.
Dashboard Settings
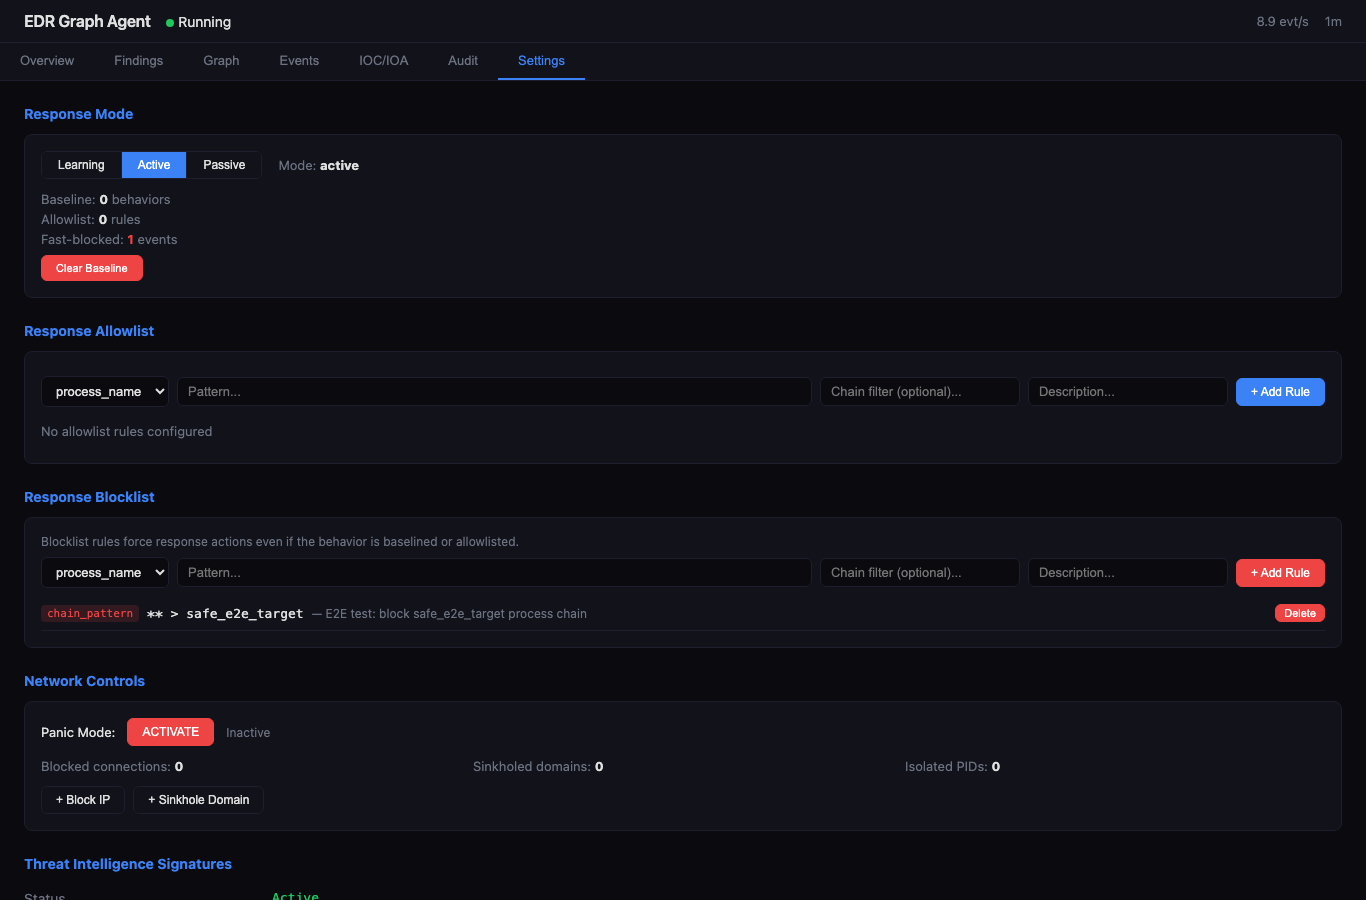
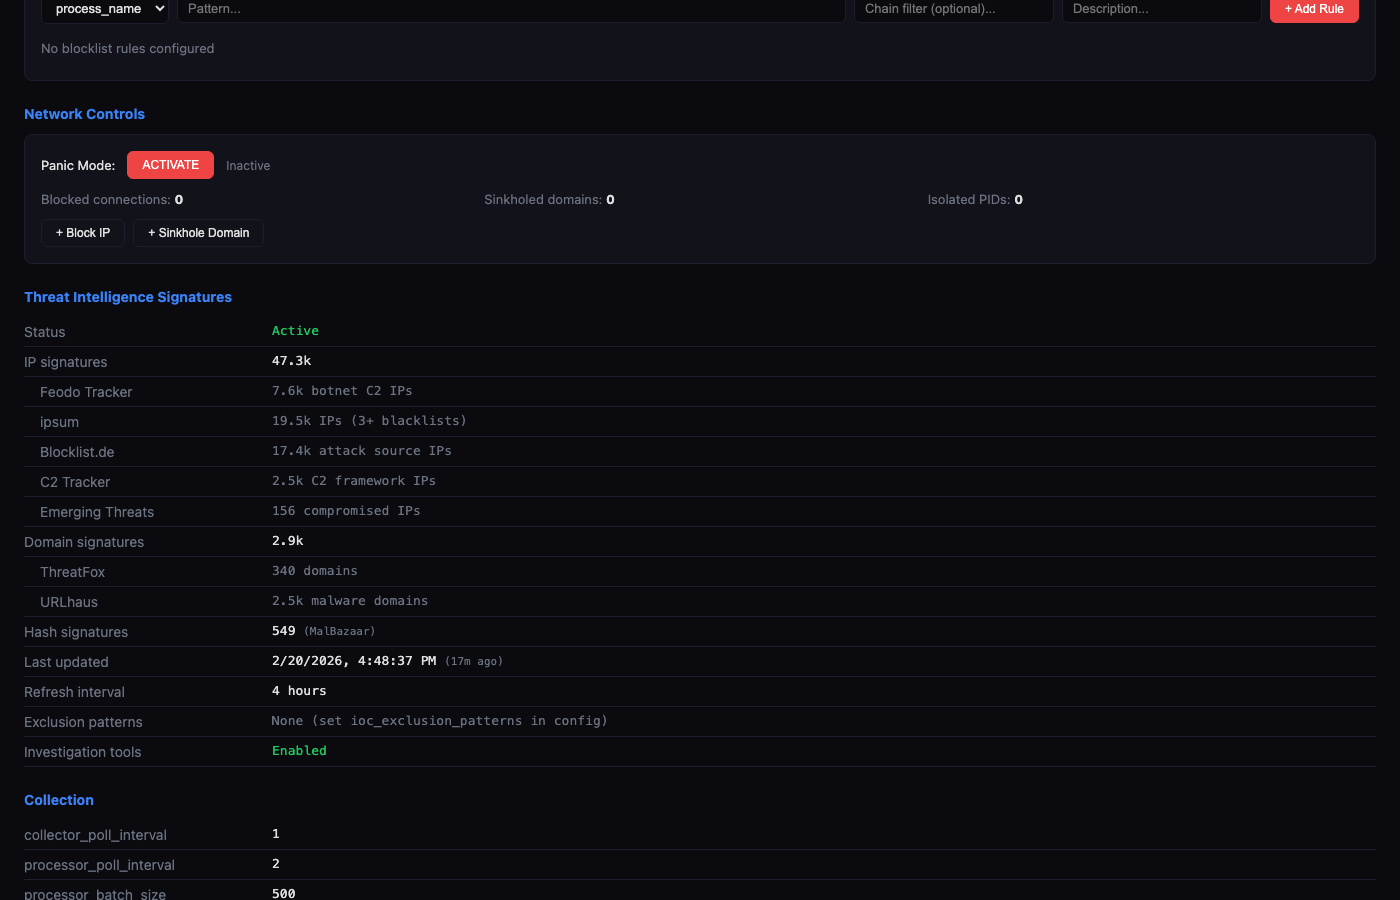
Many settings can also be changed at runtime via the dashboard Settings tab: