Quickstart Guide
Get eDR-Graph running on your machine in under 5 minutes.
Prerequisites
- Python 3.11+ (3.13 recommended)
- Root / Administrator access — required for network capture and process control
- Optional API keys for enhanced analysis:
DEEPINFRA_API_KEY— LLM threat analysis (Gemma3-27B)ABUSEIPDB_API_KEY— IP reputation lookupsVIRUSTOTAL_API_KEY— File/URL/IP reputation
Installation
git clone https://github.com/ticfinack/edr-graph.git && cd edr-graph
python3 -m venv .venv && source .venv/bin/activate
pip install -r requirements.txt

# Optional: set API key for LLM analysis
export DEEPINFRA_API_KEY="your-key-here"

# Run (requires root for network capture)
sudo .venv/bin/python3 -m agent.main --config config.yaml --log-level INFO
git clone https://github.com/ticfinack/edr-graph.git /opt/edr-graph
cd /opt/edr-graph
python3 -m venv .venv && source .venv/bin/activate
pip install -r requirements.txt

# Install as systemd service
sudo cp deploy/edr-agent.service /etc/systemd/system/
sudo systemctl daemon-reload
sudo systemctl enable --now edr-agent
git clone https://github.com/ticfinack/edr-graph.git /opt/edr-graph
cd /opt/edr-graph
python3 -m venv .venv && source .venv/bin/activate
pip install -r requirements.txt

# Install as LaunchDaemon
sudo cp deploy/com.edgeaspect.edr-graph.plist /Library/LaunchDaemons/
sudo launchctl load /Library/LaunchDaemons/com.edgeaspect.edr-graph.plist
First Run
You can also generate a default config file:
What Happens on Startup
- Kuzu graph database initialized — Schema created/migrated, buffer pool allocated
- PID index built — In-memory index of all existing process nodes for fast graph queries (~8s on 500K+ nodes)
- Collectors started — Platform-native telemetry sources activated (eBPF probe on Linux, Unified Log on macOS, ETW on Windows, psutil cross-platform)
- Dashboard launched — FastAPI web server on
http://localhost:9200 - Health/metrics server started — Prometheus metrics on port
9100
Additional startup tasks (if configured):
- IOC feed download (background thread, ~50K indicators from 8 feeds)
- Tamper detection baseline (SHA-256 of all agent source files)
- Fleet forwarder registration (if fleet mode enabled)
- macOS tray icon (menu bar integration via rumps)
Verify It Works
- Dashboard — Open
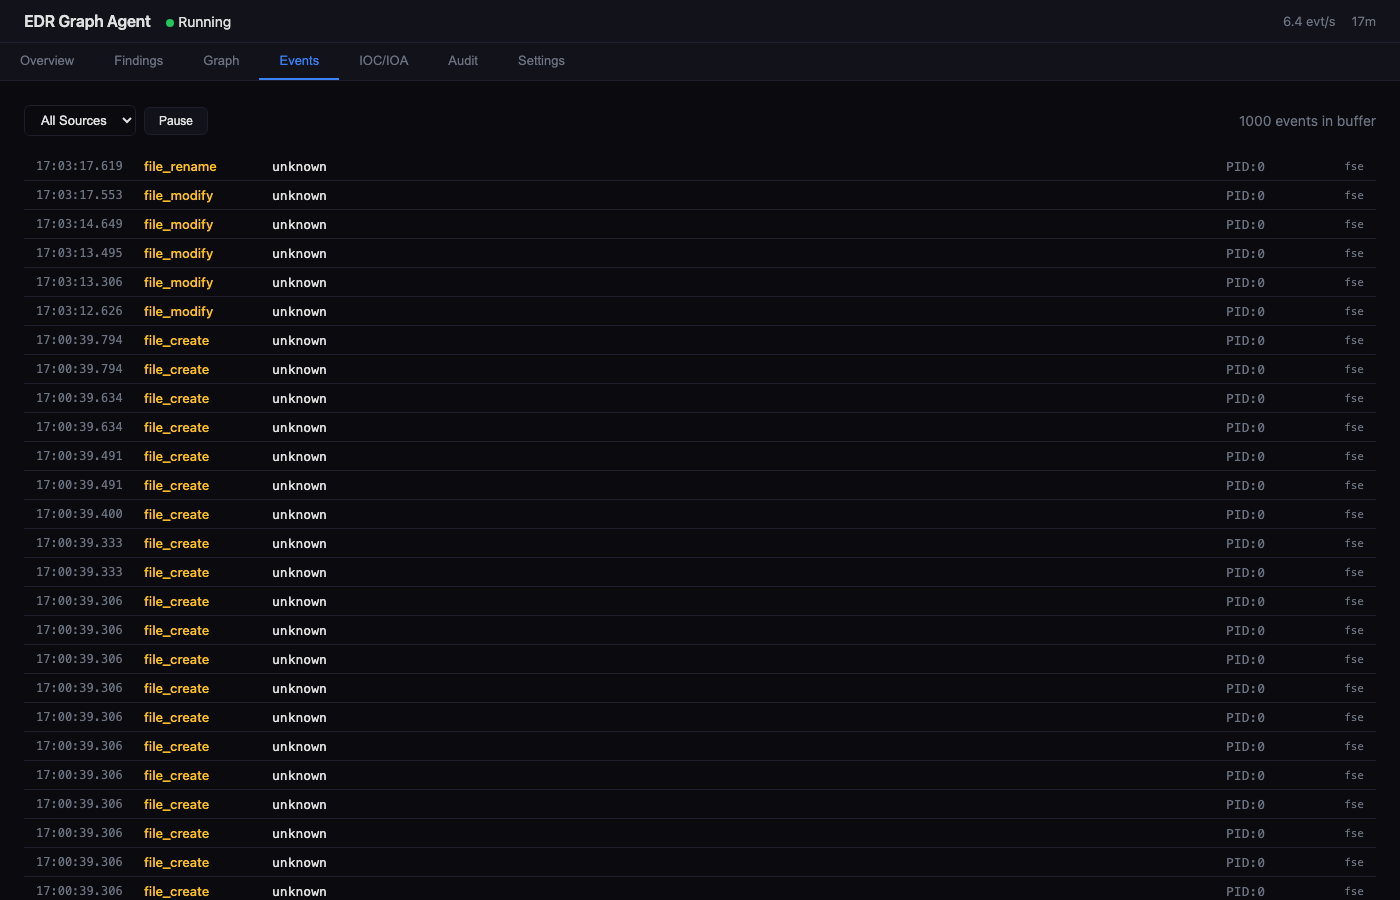
http://localhost:9200in your browser. You should see status cards, active collectors, and events streaming in. - Events tab — Confirm events are flowing (process, network, file, DNS activity).
- Health endpoint —
curl http://localhost:9100/healthzshould returnok. - Metrics —
curl http://localhost:9100/metricsreturns Prometheus metrics.
Recommended Progression
| Phase | Mode | Duration | Purpose |
|---|---|---|---|
| 1 | Learning | 24h (dev) / 1-7 days (prod) | Build behavioral baseline of normal activity |
| 2 | Passive | Ongoing | Review findings, tune allowlist/blocklist rules |
| 3 | Active | Production | Full enforcement with automated response |
Switching Modes
Dashboard: Settings tab → Response Mode dropdown → select mode.
API:
# Switch to learning mode
curl -X POST http://localhost:9200/api/response/mode \
  -H 'Content-Type: application/json' \
  -d '{"mode": "learning"}'

# Switch to active mode
curl -X POST http://localhost:9200/api/response/mode \
  -H 'Content-Type: application/json' \
  -d '{"mode": "active"}'
Next Steps
- Configuration Reference — All settings, env vars, and CLI arguments
- Telemetry Pipeline — Understand the processing architecture
- Filtering & ROE — Write effective allow/block rules